Are Wait Times Getting Worse I Did The Research And The Answer Will Surprise You
ID:
TMS-5803
Source:
wdw-magazine.com
Author:
Heather Adams
Dateline:
Posted:
Status:
Current
Data suggests the average wait time for Disneyland attractions hasn’t increased significantly in the last five years, despite how it might feel when you’re in the park.
Did it feel like you were waiting an awfully long time for every attraction last time you visited Disneyland Resort? With wait times regularly creeping well past 45 minutes and into the hour-plus territory on weekends all year long, as a Disneyland expert who’s been visiting the parks for over 35 years, I agree that it sure feels like wait times have gone up.
But I’ve been wondering if we really are standing in queues for longer periods of time, or if it just seems like Disneyland’s wait times have gotten worse. The popularity of Lightning Lane, increasingly crowded days, and even ride refurbishments sure make it seem like wait times for all of Disneyland’s attractions have increased.
So, I did the math (well, I looked at the math). Based on wait time data collected from 2019 to 2024, I’ve found that the truth about Disneyland wait times will surprise most frequent guests.
Disneyland Wait Times Have Gone Down Not Increased Since 2019
If you’re certain you might be that attraction wait times at both Disneyland Park and California Adventure have increased in the last few years, here’s the truth: Wait times have definitely changed.
But according to data, wait times only seem to have increased in recent years, because the average wait time across all of Disneyland’s attractions has actually decreased steadily since 2022.
Back in 2022, pent-up demand post-pandemic drove the average wait time up significantly as guests flooded the two theme parks. That year, Star Wars: Rise of the Resistance (the attraction with the longest line) had an average wait time of 75 minutes.
In 2024, the average wait time for Rise of the Resistance dropped to just 61 minutes. That’s nearly 15 minutes lower.
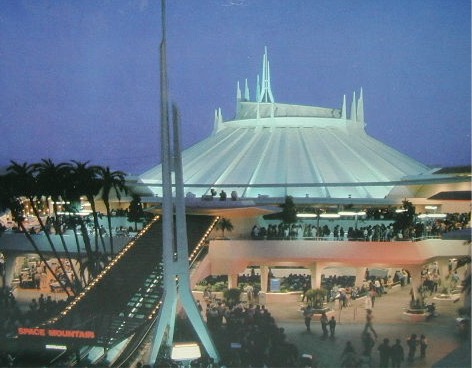
And the trend is pretty consistent across popular, in-demand rides, too. Space Mountain decreased from 46 minutes to 39 minutes from 2022 to 2024, while Radiator Springs Racers dropped from 79 minutes to 71 minutes. Guardians of the Galaxy: Mission BREAKOUT! fell from 68 minutes to just 56 minutes.
In fact, going all the way back to 2019, wait times were longer six years ago than they are today. Yep, you read that right: Disneyland wait times were worse in 2019 than 2024.
Radiator Springs Racers, for example, saw an average wait time of 77 minutes in 2019. Similarly, Toy Story Midway Mania and Soarin’ Around the World saw wait times of 47 minutes and 42 minutes that year. While they did see temporary spikes in 2022 due to that post-pandemic boom in guests returning to Disneyland, in 2024, all three of these rides now see lower average wait times by about 6 to 13 minutes.
How Long Are Disneyland Guests Waiting in Lines?
Overall, based on data collected over the last decade, Disneyland guests are spending less time waiting in line. And while wait times can seem absolutely insane some days, as a whole they’re not as bad as they look.
The actual average wait time for most rides is surprisingly low. Only one ride has an average wait time of over an hour (Radiator Springs Racers), and most of the popular attractions at both Disneyland and California Adventure clock in around 45 to 55 minute average waits.
Obviously, there is some flux involved here. During peak times of the year, Disneyland does see high wait times. And during lower crowd periods, wait times can be pretty nonexistent. So, while you might consistently encounter higher wait times if you only visit during the summer and holidays, for example, locals who can visit during less crowded seasons may see shorter overall wait times.
Why Do Disneyland’s Wait Times Seem So Much Worse Now?
There are a couple of factors that make it seem like attraction wait times at Disneyland have increased since 2019.
One key factor is the number of people visiting the park. Crowd levels have certainly increased the closure of Disneyland Resort in 2020 thanks to the COVID-19 pandemic caused a huge spike in crowds in 2022 when guests were finally allowed to return. And crowds have stayed pretty consistent year-round, with fewer “empty” days than in years past.
Additionally, the introduction of a paid “skip the line” service like Lightning Lane has reshaped attraction wait times at Disneyland. There’s no denying that Lightning Lane (and its predecessor) are the subject of plenty of complaints and criticisms. And the mere existence of any kind of “skip the line” program increases overall wait times, dragging out the time guests are spending in queues. FastPass, MaxPass, Genie+, Lightning Lane under all of its names, these programs pause the standby line, inherently preventing it from flowing as quickly as it would without any interference.
But when we look at the data, Lightning Lane appears to be the best version Disneyland has tried. As much as guests loved the free FastPass system (myself included), it’s one of the reasons that wait times have seemed to climb upwards over the years. And compared to FastPass and MaxPass in 2019 (and even Genie+ in 2021), Lightning Lane hasn’t made wait times worse. In fact, you could argue it’s become the most efficient of the bunch.
Of course, watching guests sail past the standby line with a paid Lightning Lane always makes the wait for an attraction feel extra-long. But as the numbers suggest, it’s good to keep in mind that we’re actually waiting less, on average, than just a few years ago.
Attractions Referenced In This Article:

 Access To Over 3210 Construction Photos